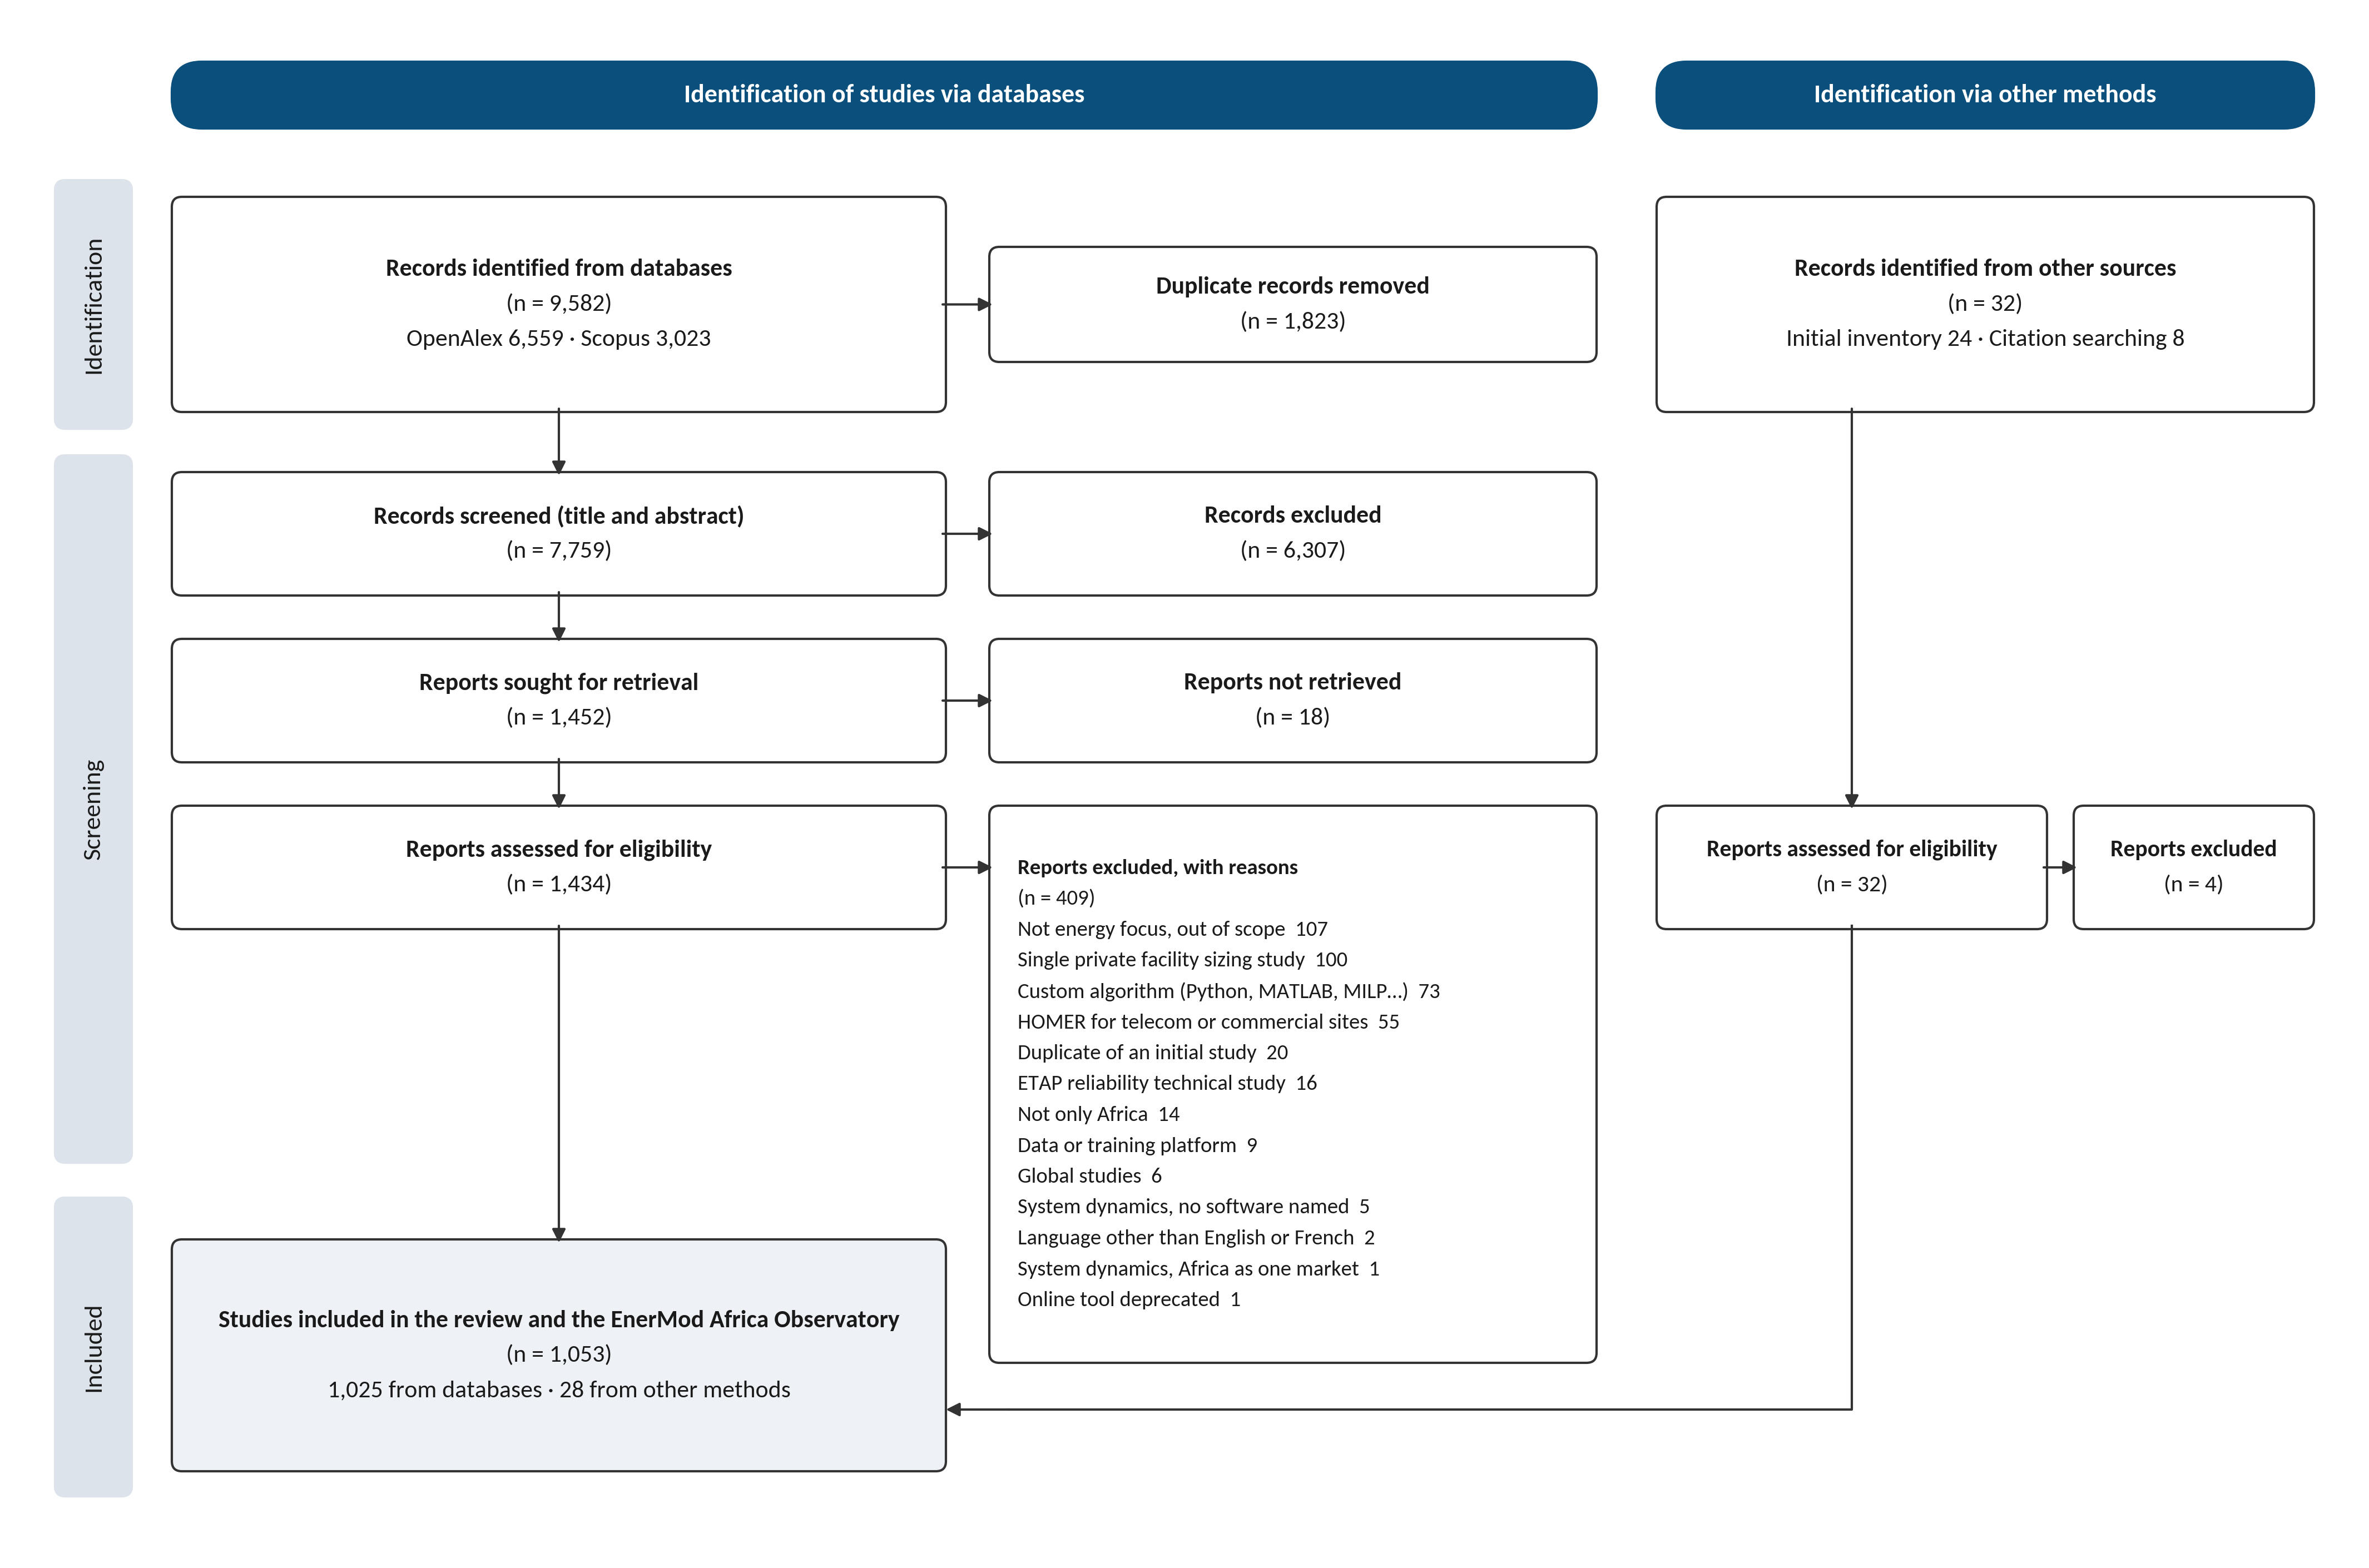
The discovery pipeline of this hub re-runs the same four blocks on OpenAlex (see Research); new matches never enter the inventory without a curator’s verification.
Model scope
Studies are grouped by the scope of the model they use. This is a property of the study, not of how it was processed.
- Whole energy-system: models that represent a complete energy system and its internal trade-offs (MESSAGE, OSeMOSYS, TIMES, LEAP, PLEXOS, Balmorel). All 51 fields are extracted.
- Focused: models that address a delimited question, such as site sizing, electricity access, spatial analysis or scenario accounting (HOMER, OnSSET, RETScreen, GIS analyses, calculators). About 34 core fields apply; fields specific to system-wide optimisation stay empty.
Mixing scopes in statistics can mislead: a ranking of tools across both groups dilutes MESSAGE or OSeMOSYS with HOMER. The analytical pages let you filter by scope.
How empty cells are treated
A blank cell means not assessed, never no. Coverage percentages are computed only over the studies where a dimension was actually evaluated:
coverage (%) = studies marked "yes" / studies where the field is non-empty × 100
The same rule applies to countries: a country not covered by a source is excluded from the corresponding ranking, never defaulted to the worst value.
Country indicators and sources
| Indicator | Source | Computation |
|---|
| Energy governance | World Bank / ESMAP, Regulatory Indicators for Sustainable Energy (RISE) 2023 | Mean of three governance indicators (electrification planning, renewable energy, energy efficiency), classified into RISE’s zones: ≥ 66.67 strong, 33.33 to 66.66 moderate, < 33.33 weak. 39 of 54 countries covered. |
| Data availability | Ember, African Electricity Data Transparency, January 2022 | 0 to 5 transparency score on national electricity production data: 3 to 5 good, 1 to 2 limited, 0 none. All 54 countries. |
| Electrification rate | World Bank WDI, EG.ELC.ACCS.ZS, 2024 release | Share of population with access to electricity, most recent year. |
| NDC and long-term strategy | UNFCCC NDC Registry and LT-LEDS portal | Submitted yes/no. |
Caveat on governance. RISE measures whether a formal regulatory framework exists, not whether it is implemented, nor a country’s modelling capacity directly. No public dataset measures modelling capacity; RISE is the best available proxy. A corpus-based measure, the share of African-led nationally scoped studies per country, is a natural complement and is shown on each country page.
Gap score (0 to 100)
A country-level measure of how under-served it is by current modelling. Higher means more under-served.
| Component | Weight | Measure |
|---|
| African feature coverage | 35 | Mean over four features (informal economy, biomass and charcoal, power reliability, urbanisation) of the share of the country’s assessed studies covering it |
| Data availability | 30 | good = 2, limited = 1, none = 0 |
| Energy governance | 20 | strong = 2, moderate = 1, weak = 0; countries not covered by RISE get the neutral mid-value 1 |
| Model density | 15 | Number of distinct tools applied, capped at 10 |
gap = (1 − feat) × 35 + (1 − dat/2) × 30 + (1 − gov/2) × 20 + (1 − min(n, 10)/10) × 15
A first version scored each dimension in binary fashion (addressed anywhere or not) and saturated quickly; the share-based version above replaced it.
Readiness score (0 to 10)
The conditions under which modelling can translate into policy. Higher means more ready.
| Component | Points | Source |
|---|
| Energy governance | strong 3, moderate 1.5, weak 0 | RISE 2023 |
| Data availability | good 3, limited 1.5, none 0 | Ember 2022 |
| Electrification rate | rate / 100 × 2 (max 2) | WDI 2024 |
| NDC submitted | 1 | UNFCCC |
| Long-term strategy submitted | 1 | UNFCCC |
readiness = gov + dat + min(elec/100 × 2, 2) + ndc + lts
Countries without RISE coverage (15 of 54, mostly small island states) receive no readiness score at all rather than being scored as unready, which is why 39 countries are ranked.
Recommender scoring
The recommender scores every publicly available tool against your answers. In-house models (licence internal) are listed but never ranked, since they cannot be obtained.
| Signal | Points |
|---|
Objective match: best_for tokens (+30), tool type (+10) | up to +40 |
| Scale fit | +12 (+6 when the tool’s scale “varies”) |
| Budget: licence, free access for African institutions, paid dependencies (GAMS, MATLAB, ArcGIS…) | −25 to +15 |
| Team capacity and support: programming required, training, helpdesk, community, documentation | −20 to +23 |
| Time horizon | +10 (+5 for long-term tools on a medium-term question) |
| Data availability against data intensity | −8 to +10 |
| African track record: ≥ 10 studies +10, ≥ 5 studies +5 | +5 to +10 |
| Optional requirements (clean cooking, financing analysis, macOS/Linux, helpdesk) | −15 to +10 each |
The open-source requirement acts as a filter rather than a penalty: a user who needs the code never sees a proprietary tool ranked first. The score is a transparent heuristic to shortlist candidates, not a substitute for expert judgement; the breakdown is shown for every recommendation.
The assistant
The assistant answers from a context assembled on the fly from the inventory (headline statistics, matching tool profiles, country records and studies) and is instructed to say when the inventory does not cover a question. Every claim it draws from a record is cited and linked, so it can be checked. It does not browse the web and it can be wrong.
Limitations
- The weights above encode editorial judgement; they are deliberate but not empirically calibrated and can be revised.
- Energy governance is a proxy for institutional readiness, not a direct measure of modelling capacity.
- The Ember score dates from January 2022 and may understate progress since.
- Scores are only as complete as the underlying extraction; focused studies contribute fewer fields by design.
- The inventory is a living document: figures change as studies are added through contributions and discovery.

 Photo: Χρίστος Ιμμανοελ, CC BY-SA 4.0