
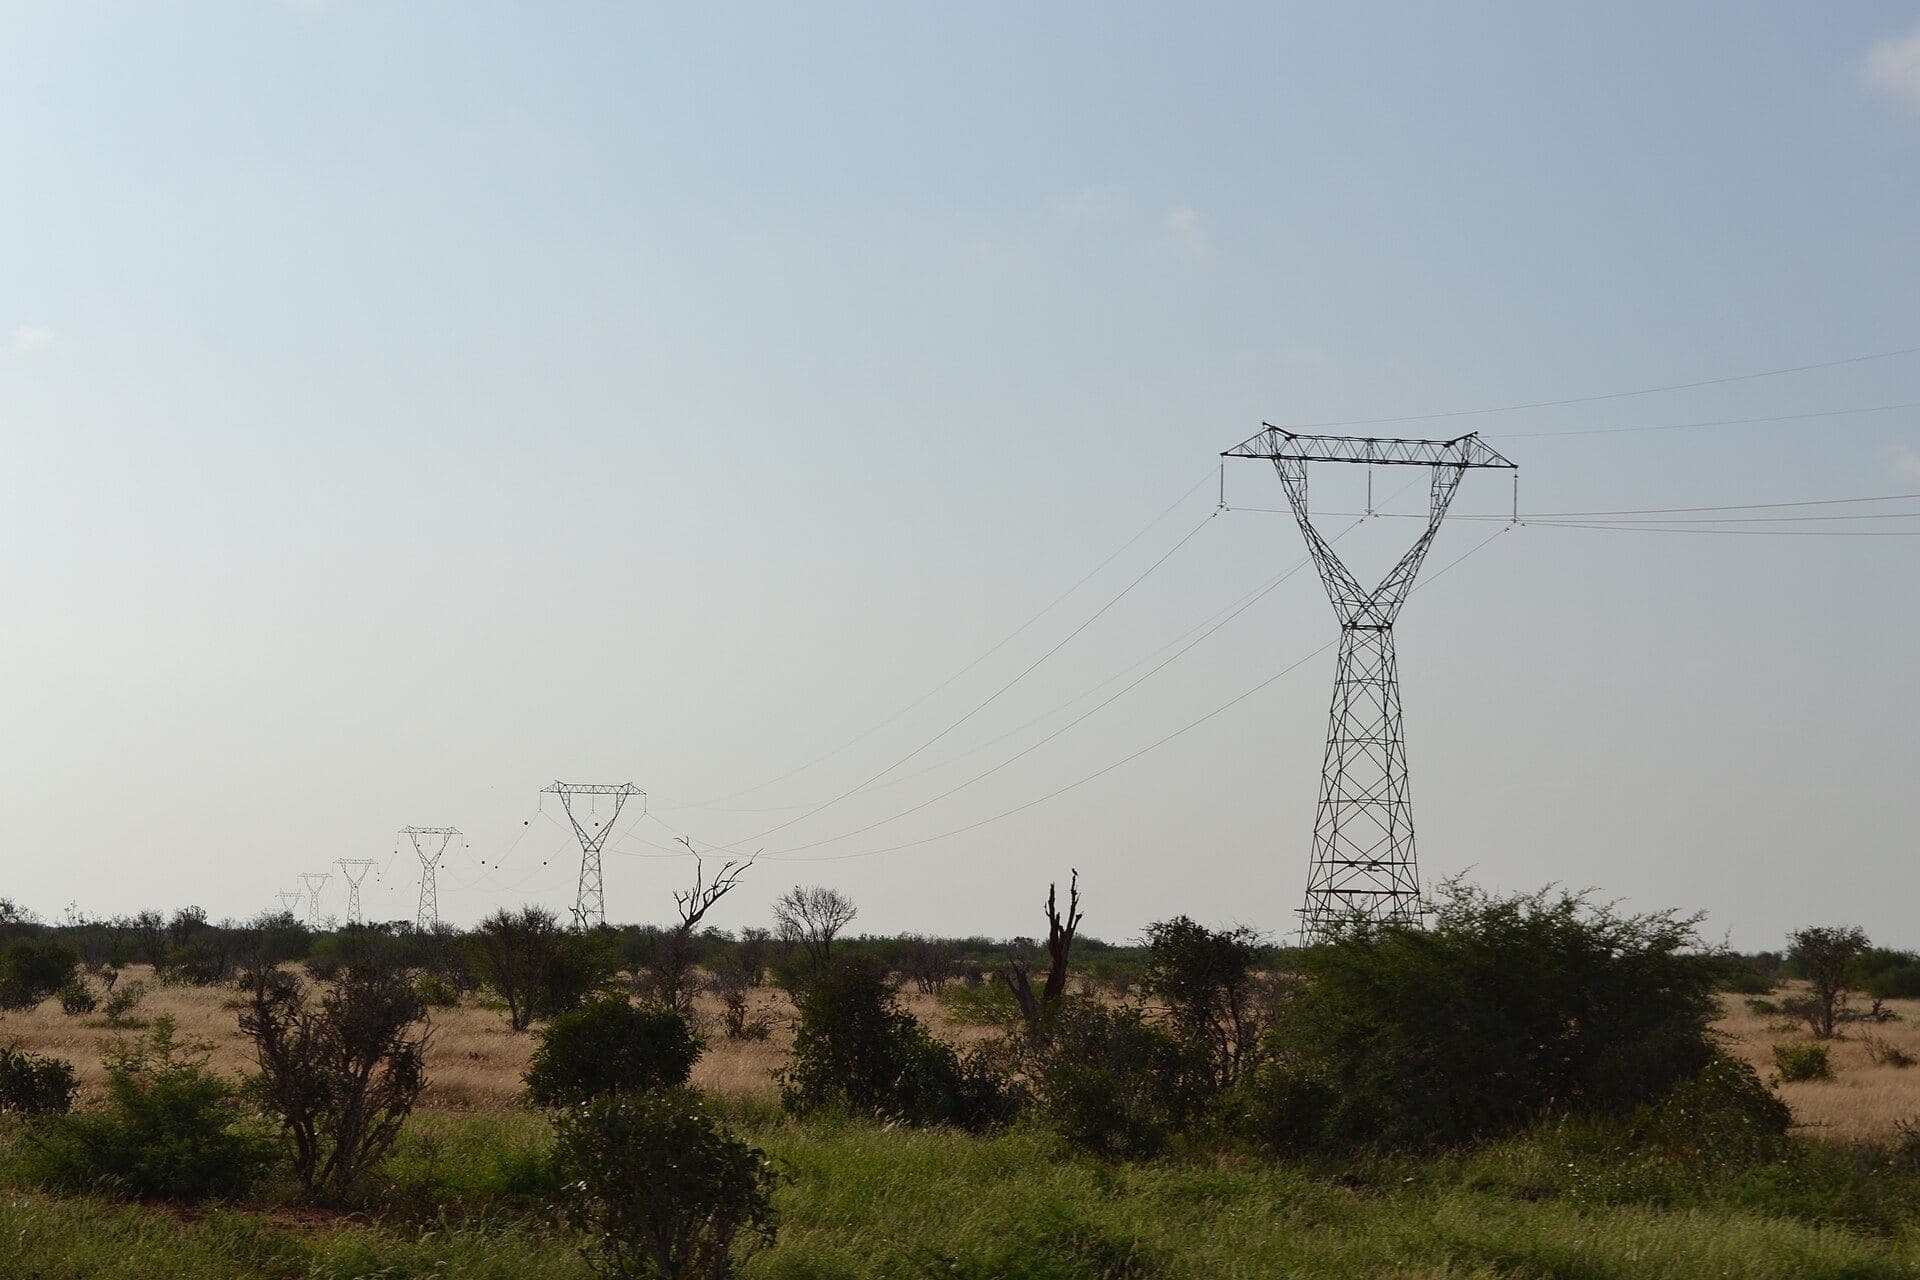
 Photo: CT Cooper, CC BY 3.0
The observatory at a glance
Headline figures of the inventory, the geography of modelling activity and the tools behind it. Every number links to the studies it is computed from.
Studies by year and scope
Whole energy-system studies at the base, focused studies above.
Who leads the modelling?
Based on author affiliations: African-led when the first author, or all authors, are at African institutions.
Studies per country
A study counts once for every country it models.
Most used tools
Studies per tool, both scopes combined; filter by scope on the Tools page.
Studies per power pool
A study counts for every pool it covers.
All countries
Sorted by studies. Gap score 0–100: higher means more under-served. Readiness 0–10.
“Not ranked” means the score cannot be computed; it is never zero.
Latest additions
Studies that entered the inventory most recently.